Data Analysis
Bytek Prediction Platform turns reconciled customer data into clear, actionable insights through flexible dashboards built around the metrics that matter most to your business.
















 ISO/IEC 27001:2022
 GDPR Compliant
 CCPA Compliant
 IAB TechLab Member
 HIPAA Compliant
Reports
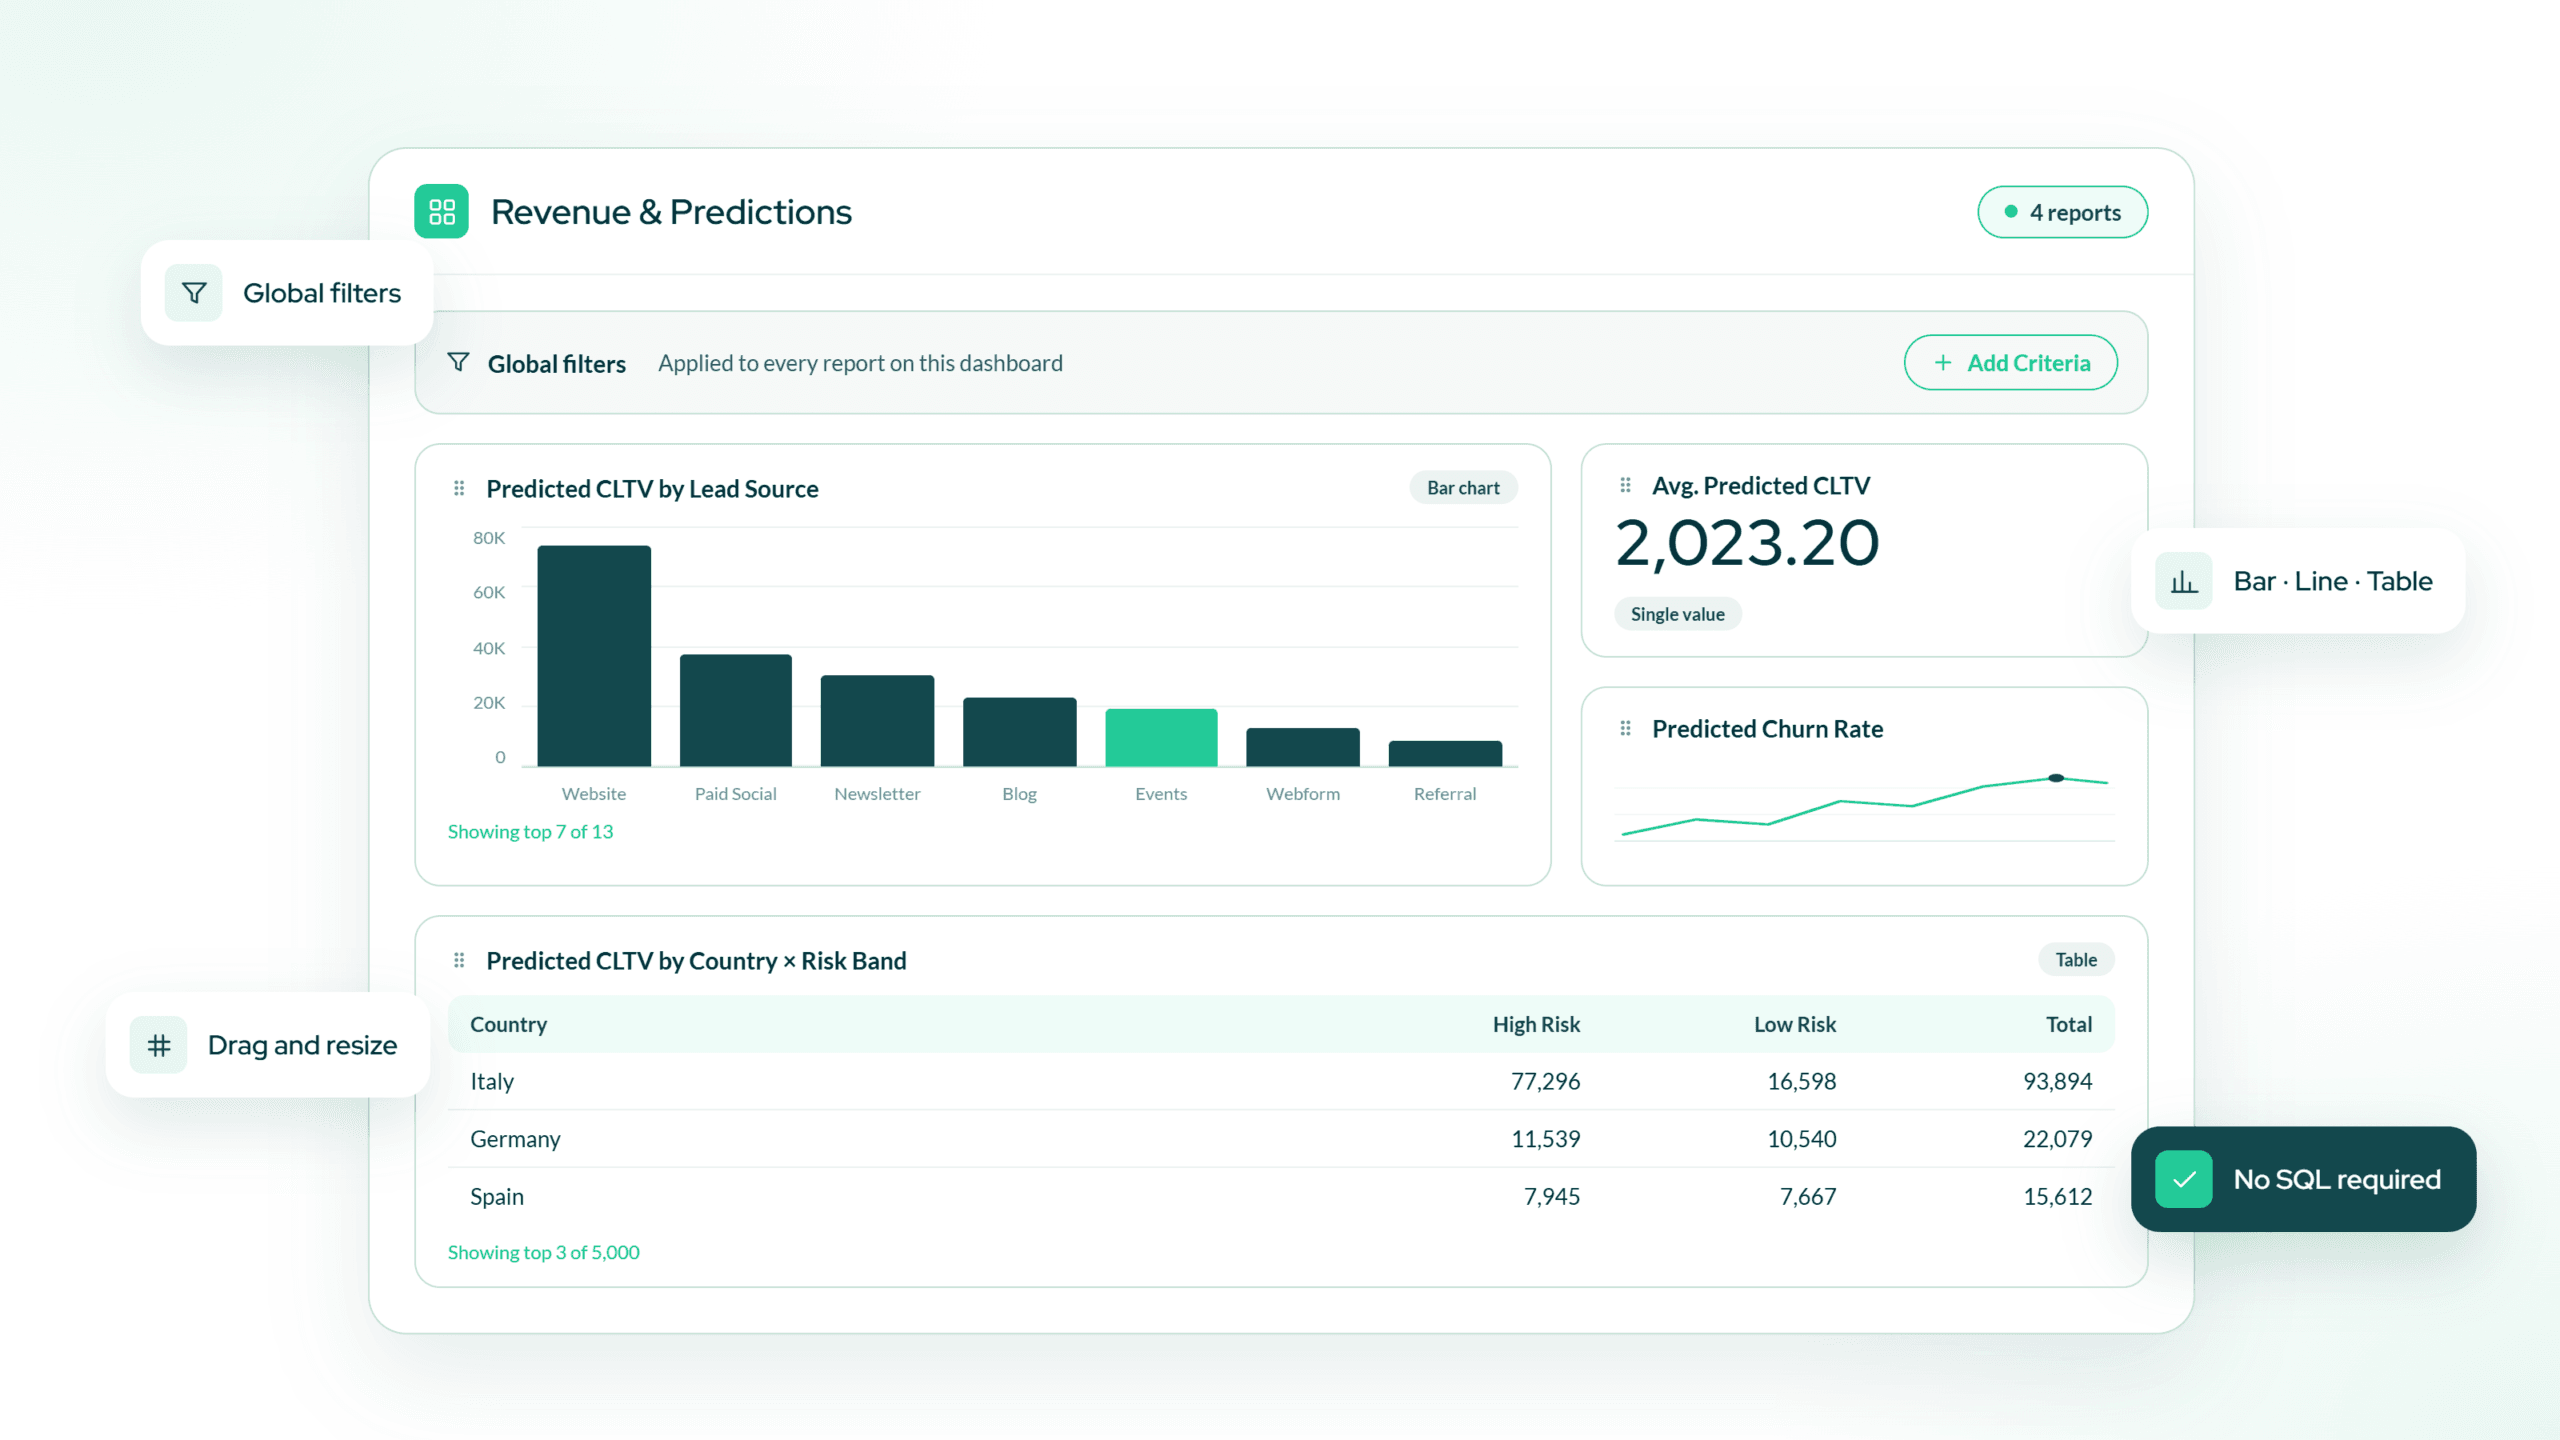
Build customized dashboards directly from your reconciled data. Select the metrics you want to analyze, break them down by dimensions and choose how to aggregate and visualize them, with a live preview before adding each tile.
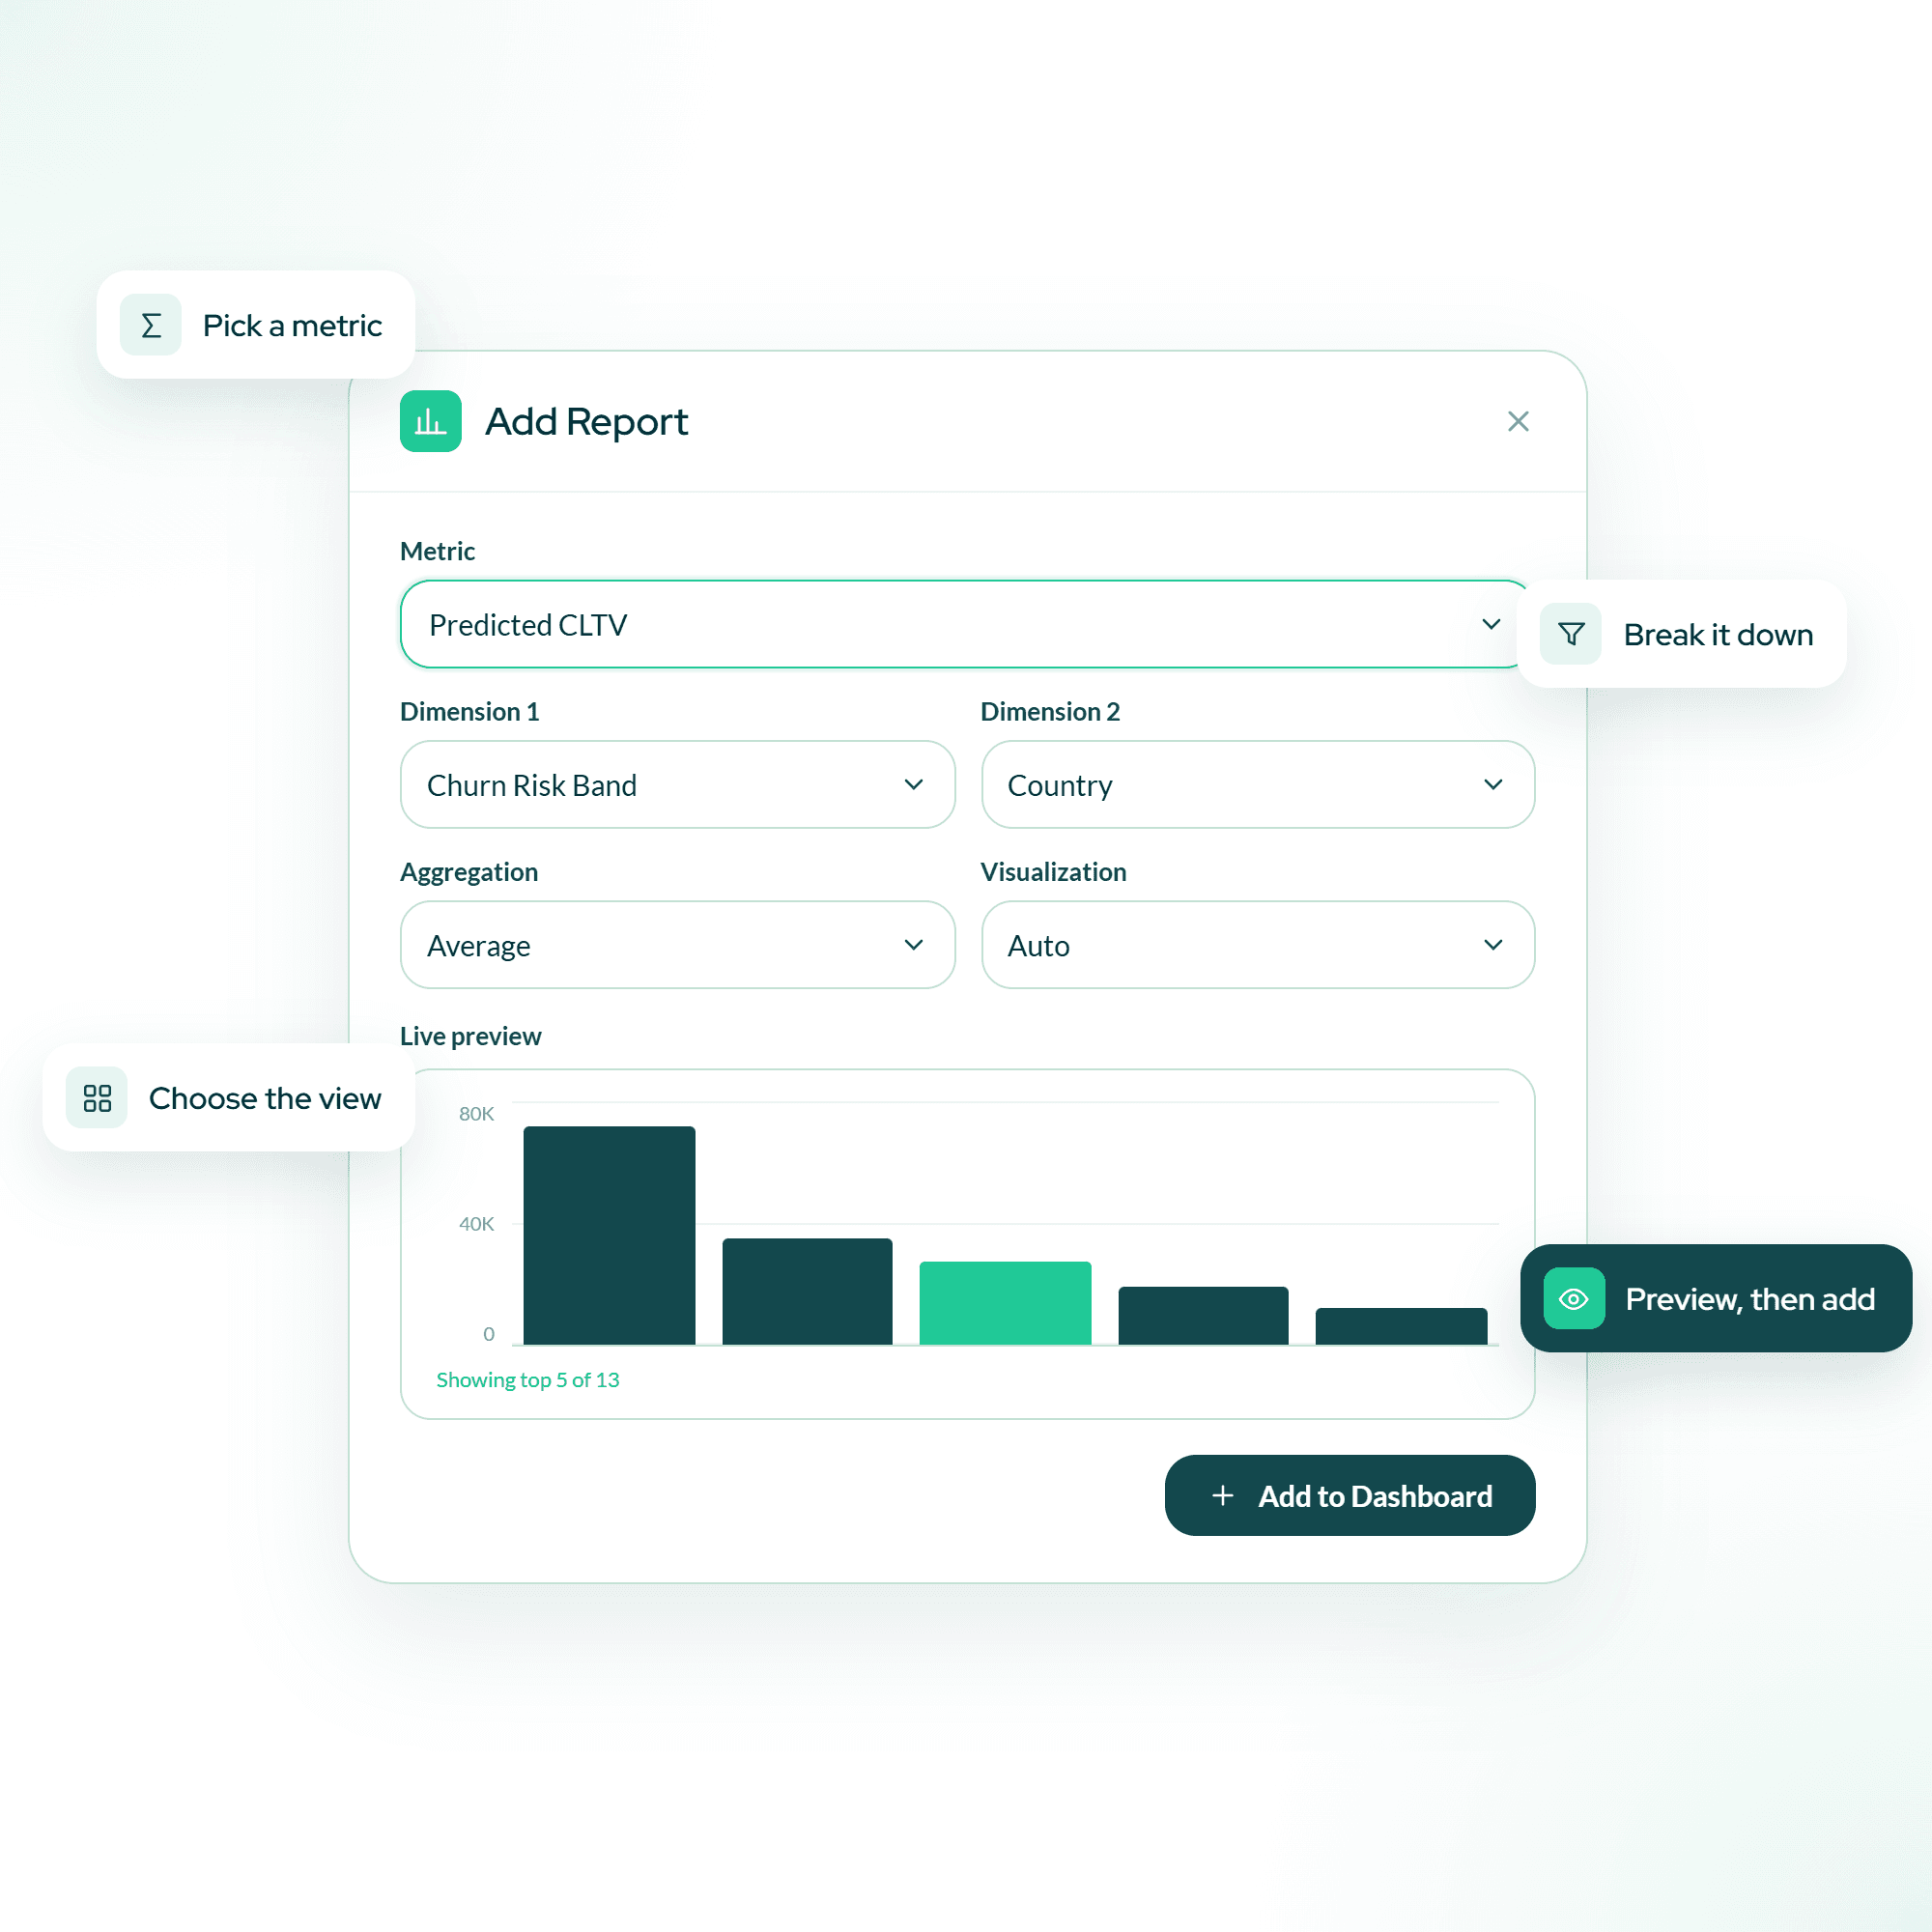
Choose the metric you want to analyze and aggregate it using Average, Sum, Count, Count Distinct, Min, Max or Median.
Break down each metric by up to two dimensions to explore your data from different perspectives.
Display your data as a single value, bar chart, line chart or table, or use Auto to let the platform select the most suitable visualization
Use calculated fields created in Field Builder as metrics within your reports, bringing custom business logic directly into your dashboards.
Applications and Results
Build Dashboards Around Your KPIs
Combine and arrange the metrics that matter most to your business by dragging and resizing tiles on a flexible dashboard grid.
Explore Specific Segments
Apply a single filter across the entire dashboard to analyze all metrics for a specific segment without editing each individual report.
Analyze Data Without Queries
Explore reconciled data and create reporting views directly within the platform without writing SQL or relying on manual queries.


